What Is Correlation in Data Analytics? A Beginner’s Guide

What Is Correlation in Data Analytics? A Beginner’s Guide
Authored by
Admin
Date Released
January 9, 2026
Comments
0 Comments
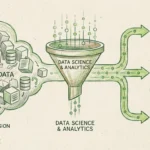
Correlation in data analytics is a statistical measure that expresses the extent to which two variables change in relation to each other. It helps businesses identify patterns—such as the relationship between marketing spend and revenue—allowing leaders to make predictive decisions based on historical data trends rather than intuition.
-
It’s About Relationships: Correlation measures how strongly one specific variable moves in relation to another.
-
Not a Crystal Ball: It shows connection, not necessarily cause (Correlation $\neq$ Causation).
-
Three Types: Relationships can be positive (moving together), negative (moving opposite), or zero (no link).
-
Business Value: It is the foundation of predictive maintenance, dynamic pricing, and targeted marketing.
Let’s face it: you are likely drowning in data.
Between your website analytics, CRM records, and sales spreadsheets, you have thousands of rows of numbers. But numbers alone don’t tell a story. They don’t tell you why sales spiked last Tuesday or why customer retention dropped in Q3.
This is where Correlation steps in.
Think of correlation as the flashlight in a dark room. It helps you see the invisible threads connecting different parts of your business, turning raw noise into actionable strategy. Here is the deal on how it works and why you should care.
The 3 Types of Correlation Explained
In the world of data analytics, relationships generally fall into three buckets. Understanding these simple concepts can save you a fortune in wasted resources.
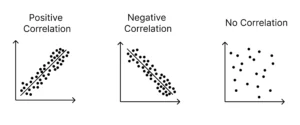
1. Positive Correlation
This happens when two variables move in the same direction. As one goes up, the other goes up.
-
Business Example: As your Google Ad spend increases, your website traffic increases.
-
The Strategy: Identify these drivers and double down on them.
2. Negative Correlation
This occurs when two variables move in opposite directions. As one goes up, the other goes down.
-
Business Example: As the price of a product increases, the volume of sales decreases.
-
The Strategy: This is crucial for pricing strategy. You need to find the “sweet spot” where price is high enough for profit but low enough to maintain volume.
3. Zero Correlation
There is no relationship at all.
-
Business Example: The amount of coffee your developers drink vs. the customer churn rate.
-
The Strategy: Stop trying to optimize variables that don’t impact your bottom line.
The Golden Rule: Correlation vs. Causation
This is the trap that most rookie analysts fall into.
Just because two things happen at the same time doesn’t mean one caused the other. For instance, ice cream sales and shark attacks both spike in July. Does eating ice cream cause shark attacks?
No. They are both correlated to a third variable: Hot Weather.
Why this matters for business: If you blindly follow correlation without context, you might make costly mistakes. You might think a new website feature caused a sales drop, when in reality, it was just a seasonal holiday slump. At IT For Future, we use advanced data modeling to dig deeper, ensuring we aren’t just seeing patterns, but finding the root cause.
Practical Business Use Cases
You don’t need to be a mathematician to use this. Here is how we apply correlation analysis for our clients:
-
Inventory Management: We analyze the correlation between local weather patterns and cement sales (for construction clients) to predict stock needs.
-
Customer Loyalty: correlating response times on support tickets with customer renewal rates.
-
E-Commerce: analyzing which products are frequently bought together (Positive Correlation) to build better “Upsell” bundles.
Visit for Data Science & Analysis Services
The “IT For Future” Edge
Most off-the-shelf software will give you a simple chart and wish you good luck.
We take a different approach. We don’t just look at Excel sheets; we build Custom Data Pipelines using Python and SQL that ingest data from every part of your business. We calculate the Pearson Correlation Coefficient (a fancy term for the strength of the relationship) to give you a precise score from -1 to +1.
We turn “I think this is working” into “We know this variable drives 40% of our growth.”
Conclusion
Data without correlation is just trivia.
If you are ready to stop guessing and start knowing exactly which levers to pull in your business, you need deeper insights. Don’t let valuable data sit in a silo gathering dust.
Ready to find the hidden patterns in your business?